HubSpot’s Traffic Analytics Tool: A Complete Guide to Reports and Performance Tracking

Modern marketers face the challenge of analyzing scattered website data across multiple platforms and systems. HubSpot’s Traffic Analytics Tool solves this problem by providing a unified dashboard for comprehensive traffic analysis. The platform integrates performance tracking and campaign insights, enabling marketers to make data-driven decisions with confidence.

By connecting marketing interactions directly to revenue generation, HubSpot delivers actionable insights for strategy optimization. The tool streamlines reporting across all marketing channels, helping teams understand their impact and adjust tactics accordingly.

Key Takeaways

  • HubSpot’s tool consolidates all your site traffic data into a single, user-friendly dashboard, making traffic analysis straightforward and efficient.
  • Track and analyze traffic sources, UTM parameters, and geographic distribution to understand your audience better.
  • Compare performance across devices and browsers to enhance user experience and optimize site compatibility.
  • Connect traffic data with lead and customer information for comprehensive conversion tracking and ROI analysis.
  • Monitor real-time performance metrics with customizable reports focusing on page views, user behavior, and engagement patterns.

What is HubSpot’s Traffic Analytics Tool?

HubSpot’s Traffic Analytics Tool transforms complex website data into clear, actionable insights for marketing professionals. The platform delivers comprehensive insights by breaking down traffic patterns into meaningful categories that matter to businesses.
What is HubSpot's Traffic Analytics Tool
What is HubSpot’s Traffic Analytics Tool

This powerful analytics solution helps teams track crucial metrics like sources, topic clusters, and geographic locations. The tool’s intuitive interface makes it simple to understand visitor behavior patterns and engagement across your website.

Marketing teams can leverage these insights to identify emerging trends and make strategic adjustments in real-time. By providing detailed visibility into website performance, the tool empowers marketers to optimize their digital presence and improve conversion rates effectively.

Getting Started with HubSpot’s Traffic Analytics Tool

1. Accessing the Tracking Code

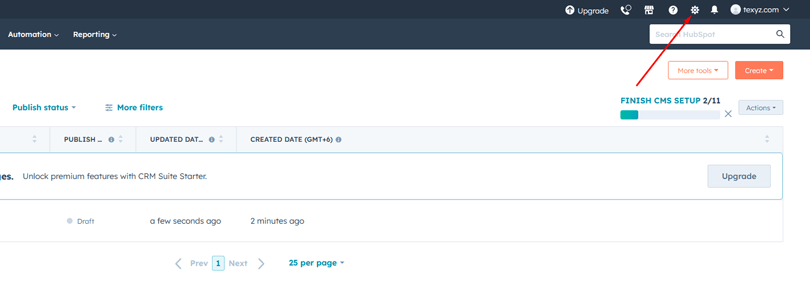
To begin, log into your HubSpot account and click the settings icon in the navigation bar.
Your subscription level determines how you access the tracking code:
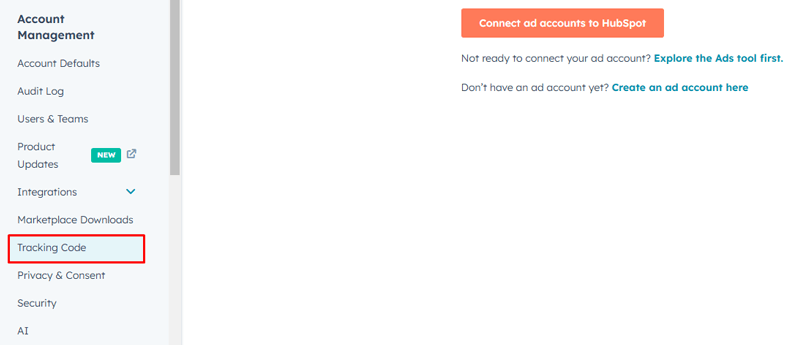
  • Marketing Starter/Free users: Navigate to “Tracking Code”
  • Premium subscribers: Go to “Tracking & Analytics > Tracking Code”

2. Implementation Options

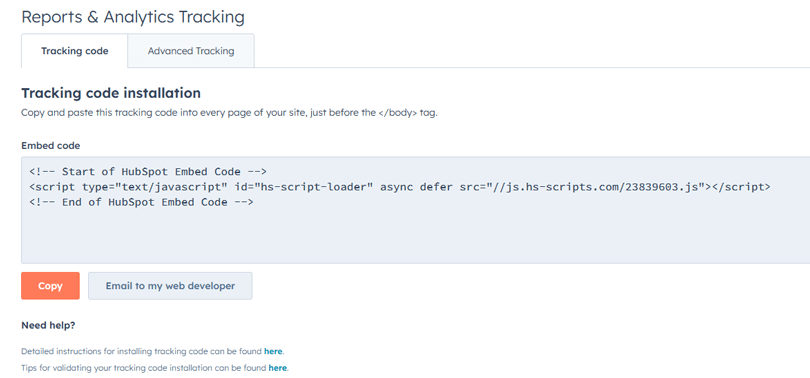
Once you’ve located the tracking code, you have two simple implementation options. Click “Copy” to copy the code directly or choose “Email to My Web Developer” to forward it for installation.
3. Installing the HubSpot Tracking Code

The first step in utilizing HubSpot’s analytics is installing their tracking code on your website. Paste the tracking code just before the closing tag in your site’s HTML. Your content management system (CMS) or development team can implement this code site-wide through a footer file for seamless integration.

Recommended Blogs for You:
How to Add HubSpot Chat to Your Website: An Easy Guide
Set Up Site Tracking in HubSpot: A Comprehensive Guide
HubSpot AI Website Builder Review
Zendesk HubSpot Integration: A Comprehensive Guide
How to maintain your HubSpot Themes to ensure optimal performance

Understanding Web Traffic Reports

1. Traffic Sources

The Traffic Sources report provides valuable insights into how visitors discover your website. HubSpot categorizes traffic based on predefined sources, helping you understand which channels drive the most engagement. This data empowers you to make informed decisions about your marketing strategies.

How to Use Traffic Sources Report:

  1. View Your Data The default bar chart displays total sessions by source, giving you an immediate overview of traffic distribution.
  2. Customize Metrics Click “Edit columns” in the top-left corner to select metrics that align with your analysis goals.
  3. Choose Visualization Style Access the “Style” dropdown in the top-right corner to switch between area, column, or line charts.
  4. Analyze Individual Sources Select specific sources to examine their performance metrics in detail, including trends and patterns.
  5. Compare Performance Use the comparison table to analyze multiple sources simultaneously, helping identify your most effective channels.

2. Pages Report

The Pages Report serves as a crucial tool for understanding your website’s performance across different content types. This powerful feature enables you to analyze how various sections of your website engage with visitors.

How to Filter by Page Type:

1. Access Content Types Menu

  • Navigate to the right sidebar
  • Locate and click the Content Types dropdown menu
  • View available page categories

2. Select Content Category

  • Choose from options like blog posts, landing pages, and knowledge articles
  • Focus your analysis on specific website sections
  • Get detailed performance metrics for each content type

Advanced Filtering Capabilities:

  • Additional Metrics
  • Blog Content Analysis
  • Domain-Specific Insights

Note: For secondary domains, create custom views in HubSpot Google Analytics

3. UTM Parameters Report

The UTM Parameters Report helps you analyze traffic from custom tracking URLs and measure campaign effectiveness. This powerful feature provides deep insights into how different marketing initiatives drive website visits.

Using UTM Parameter Analysis:

1. Set Your Focus Parameter

  • Navigate to the top of the report
  • The default view shows the ‘Campaign’ parameter
  • Choose alternative options like ‘Source’ or ‘Medium.’
  • Align parameters with your campaign tracking needs

2. Choose Performance Metrics

  • Access the top-left dropdown menu
  • Start with default ‘Page views’ metric
  • Explore other metrics like ‘Sessions’ or ‘New Users’
  • Select metrics that match your campaign goals

3. Customize Data Visualization

  • Find the Style dropdown in the upper right
  • Select from area, column, or line charts
  • Choose the format that best presents your data
  • Adjust visualization to identify trends clearly

4. Analyze Specific Pages

  • Locate the table below the main chart
  • Select checkboxes for individual pages
  • Compare UTM performance across different pages
  • Identify which content responds best to specific campaigns

4. Geographic and Technology Reports

Device Types Report

Understanding how visitors interact with your website across different devices is crucial for optimizing user experience. The Device Types Report helps you analyze traffic patterns across desktop, tablet, and mobile platforms.

How to Use the Device Report:

1. Select Your Metrics

  • Click “Sessions” in the top-left corner
  • Choose metrics aligned with your analysis goals
  • Track device-specific performance indicators

2. Customize Visualization

  • Use the Style dropdown in the upper right
  • Choose between area, column, or line charts
  • Optimize data presentation for clearer insights

3. Analyze Device Performance

  • Select specific devices from the chart below
  • Compare engagement across different platforms
  • Identify opportunities for device-specific optimization

Countries Report

Track your global audience using the Countries Report, which segments traffic by location using ISO 3166 standard country codes. This report helps inform your international marketing strategy.

Key Features:

  1. Configure Metrics
  2. Visualize Geographic Data
  3. Regional Analysis

Browsers Report

Browser compatibility affects user experience significantly. Use this report to ensure your site performs well across all browsers.

Analysis Steps:

1. Choose Your Metrics

  • Select metrics from the upper-left menu
  • Track browser-specific performance data
  • Monitor user behavior patterns

2. Set Visualization

  • Pick from multiple chart options
  • Create clear, actionable visualizations
  • Compare data across different browsers

3. Filter Browser Data

  • Select specific browsers for analysis
  • Compare performance across platforms
  • Identify and address compatibility issues

Customizing and Managing Reports

Data Customization Options

1. Set Time Parameters

  • Choose your date range from the right sidebar dropdown
  • Select data frequency (daily, weekly, or monthly)
  • Note: Weekly reports default to starting on Sunday
  • Remember: Rolling date ranges exclude the current day

2. Apply Advanced Filters

  • Click “+ Add filter” for additional metrics
  • Select specific data aspects to analyze
  • Watch changes reflect in both charts and data tables
  • Customize views based on your analysis needs

Report Management

1. Exporting Your Data

  • Click “Actions” above the chart
  • Choose “Export” from the menu
  • Name your file clearly
  • Select format (CSV, XLS, or XLSX)
  • Download your customized report

2. Saving for Future Use

  • Click “Save Report” above the chart
  • Provide a descriptive report name
  • Choose dashboard placement:
    • Add to existing dashboard
    • Create new dashboard
  • Set visibility permissions (shared, read-only, or private)
  • Finalize with “Save & add”

Understanding User Interactions

1. Sessions vs. Contacts

  • Sessions represent individual website visits and page explorations
  • Contacts are users who actively engage through forms or newsletters
  • Track conversion rates from visitors to contacts to customers
  • Measure marketing funnel effectiveness at each stage

2. Key Performance Indicators

  • Monitor total page views and unique visitors
  • Track entrance and exit patterns across your site
  • Analyze bounce rates to improve engagement
  • Measure average time on page for content effectiveness

3. CTA and Mobile Performance

  • Track CTA views, clicks, and conversion rates
  • Monitor AMP performance on mobile devices
  • Evaluate user actions and engagement patterns

Common Challenges and Solutions

1. Managing External Page Data Problem: Data limits can cause incomplete reporting for external pages.

 Solution:

  • Prioritize tracking for critical pages
  • Integrate complementary analytics tools
  • Consider HubSpot plan upgrades for expanded tracking

2. Improving Data Accuracy Problem: “Other Pages on Domain” can create tracking gaps. 

Solution:

  • Review tracking setup regularly
  • Organize pages into specific categories
  • Use URL parameters for better classification

2. Optimizing Tracking Implementation Problem: Duplicate content and cross-domain tracking issues.

 Solution:

  • Implement canonical URLs
  • Customize tracking codes for specific needs
  • Set up proper cross-domain tracking parameters

Top-notch HubSpot CMS Themes

Take your HubSpot CMS powered website to the next level with these stunning and modern themes.

Explore Themes

Frequently Asked Questions

How do I set up HubSpot’s Traffic Analytics Tool?

To set up HubSpot’s Traffic Analytics Tool, 
1. Log into your HubSpot account
2. Navigate to the Reports tab
3. Click “Analytics Tools”
4. Select “Traffic Analytics”
5. Configure domain settings and tracking codes

Can I use HubSpot’s analytics tool with a non-HubSpot website?

Yes, HubSpot’s analytics tool can be used with a non-HubSpot website. Simply install the HubSpot tracking code on your external website to access all analytics features. This works with any web platform or CMS.

How do I export my data from HubSpot?

To export data from HubSpot, go to the report or dashboard you want to export.
1. Click the “Export” button (top-right corner).
2. Choose your format (CSV or Excel).
3. Follow download prompts.

Why does my data change over time?

Data in HubSpot reports may change over time due to ongoing data processing. Including:
1. Website updates.
2. Tracking setting adjustments.
3. HubSpot’s continuous data refinement.

How can I improve my website’s bounce rate using HubSpot?

You can improve your website’s bounce rate using HubSpot by analyzing visitor behavior with the Traffic Analytics Tool. Optimize content, improve load times, and create engaging landing pages based on insights gained from the tool to keep visitors on your site longer.

What should I do if I reach the limit for tracking external URLs?

If you reach the limit for tracking external URLs in HubSpot, consider upgrading your HubSpot subscription to a plan that offers a higher limit. Alternatively, review and prioritize the URLs you are tracking, removing any less critical ones to free up space for more important URLs.

Conclusion

HubSpot’s Traffic Analytics Tool is an essential resource for marketers seeking to understand and optimize their website’s performance. By consolidating key metrics into one intuitive dashboard, it empowers you to make data-driven decisions, improve marketing strategies, and ultimately drive better results. 

Whether you’re analyzing traffic sources, optimizing page performance, or measuring international reach, HubSpot’s Traffic Analytics Tool provides the detailed insights needed to make informed decisions. 

With features spanning from basic tracking code implementation to advanced UTM parameter analysis, it serves as an all-in-one platform for transforming complex website data into actionable marketing strategies that drive measurable results.